
• ENERGY DATA TOOLS
From data collection to live market interfaces
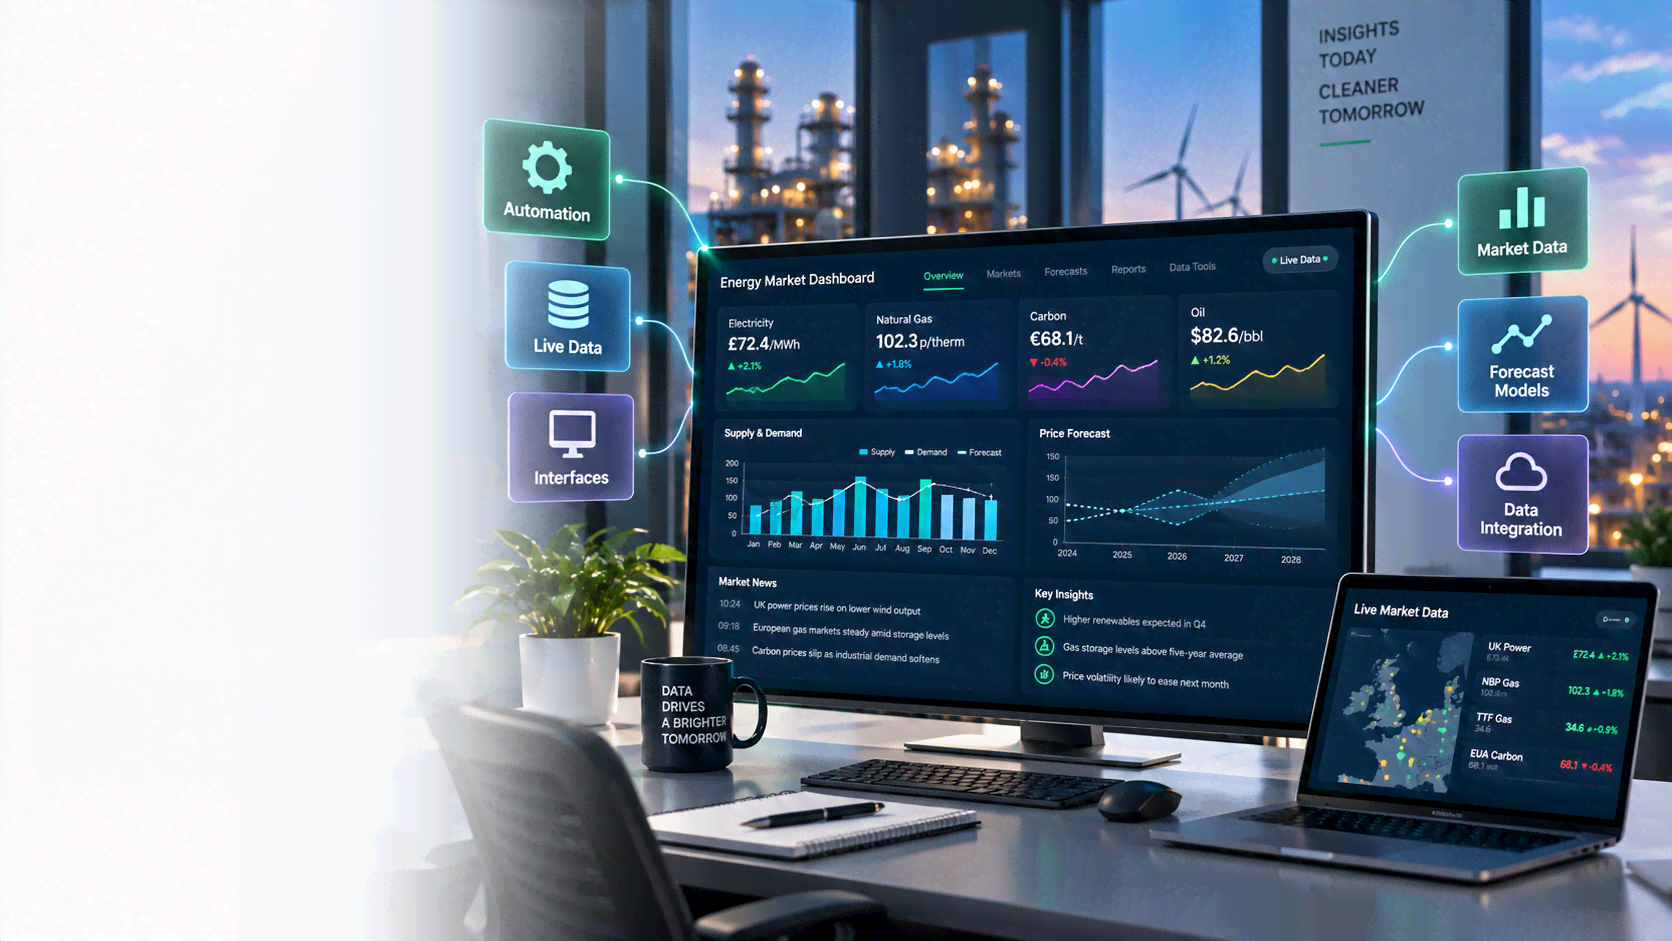
Bring together the data processes and interfaces that support market analysis, forecasting workflows, and daily monitoring across power and gas.
Overview
The tools between data and decisions.
We build practical tools for collecting energy market data, organising repeatable forecast workflows, and viewing live pricing and balancing information in the context your team needs.
Automated
Data collection
Live
Interfaces
Repeatable
Workflows
WHAT YOU GET
Everything you need,
built in
Data Collection & Forecast Automation
Use scraping, APIs, and Dagster-orchestrated workflows to organise repeatable data and forecasts.
Live Pricing & WynneView
View live pricing with Trayport integration and bring market data together with your working context.
Live Balancing Interfaces
Follow changing balancing information through interfaces designed for everyday market monitoring.
Workflow Orchestration
Make data and forecast processes reliable, scheduled, observable, and easier to maintain.
Market Data Connections
Connect the providers, feeds, spreadsheets, and services your analysis depends on.
Analyst-Friendly Interfaces
Give teams clear views of the data and market signals they need to act on.
OUR PROCESS
How we deliver
Discovery & Strategy
We start by understanding your goals, users, and constraints — then map a clear roadmap forward.
Design & Planning
Detailed planning, wireframes, and design work happen before we write a single line of production code.
Build & Iterate
Rapid delivery with weekly check-ins so you see progress, share feedback, and shape the outcome.
Launch & Support
Thorough QA, smooth deployment, and ongoing support so your solution keeps performing after go-live.
WHY IT MATTERS
The outcomes you can
actually measure
Less manual data work
Automate repeatable collection and forecasting tasks so analysts can focus on the market.
One connected workflow
Bring data, forecasts, live pricing, and balancing information closer together.
Tools people actually use
Interfaces are designed around daily decisions and the context behind them.
FAQ
Common questions
Dagster can orchestrate repeatable data collection and forecast workflows, making them easier to run, monitor, and maintain.
Yes. We can connect your providers and workflows and shape the interface around the views your team needs.
Yes. WynneView can run within your own IT environment. See our On Premises Solutions page for deployment and integration options.
MORE IN ENERGY
Related solutions
On Premises Solutions
Run gas balances, live pricing, positions, and P&L tools inside your own IT environment.
Research & Market Analysis
Understand UK power and European gas markets through balances, market data, and clear analysis.
Modelling & Forecasting
Explore power dispatch, prices, gas supply, and market outcomes through practical models and forecasts.
Ready to connect your energy data and market tools?
Tell us where your data comes from and how your team monitors the market today.